
Not sure if your CPU or GPU is the bottleneck killing your FPS? This simple guide shows you exactly how to check, identify, and fix CPU or GPU bottlenecks in any PC game in 2026.
You’re in the middle of a game and your FPS feels lower than it should. You’ve tried tweaking settings, but nothing seems to help. The real problem might be a CPU or GPU bottleneck — one component is working at its limit while the other is sitting idle, and that imbalance is quietly strangling your frame rate.
This guide will show you exactly how to figure out whether your CPU or GPU is limiting your FPS, how to read the numbers, and what you can actually do about it — no tech degree required.
What Is a Bottleneck and Why Does It Kill Your FPS?
Think of your PC like a two-lane highway. Your CPU handles the game logic, AI, physics, and feeding draw calls to the GPU. Your GPU takes those draw calls and renders the actual pixels on screen. If one lane is congested and the other is empty, the whole system slows down.
A bottleneck happens when one component maxes out while the other has headroom to spare. The result? Frames per second tank, stutters appear, and no amount of lowering graphics settings seems to help — because you’re fixing the wrong part.
There are two types most gamers run into:
- CPU bottleneck: Your processor can’t keep up with feeding the GPU. The GPU is mostly idle, waiting for work.
- GPU bottleneck: Your graphics card is working flat out while the CPU has plenty of spare capacity. This is actually normal and ideal in most gaming scenarios.
Understanding which one you’re dealing with changes everything about how you fix it.
How to Check If Your CPU or GPU Is the Bottleneck
Step 1: Use MSI Afterburner + RivaTuner to Monitor in Real Time
MSI Afterburner is the go-to free tool for monitoring GPU and CPU usage while gaming. Pair it with RivaTuner Statistics Server (which comes bundled) and you get a live on-screen overlay showing exactly what each component is doing.
⬇️ Download MSI Afterburner (Free)
Installation steps:
- Download and install MSI Afterburner with RivaTuner included.
- Open Afterburner and go to Settings → Monitoring.
- Enable CPU Usage (All Cores) and GPU Usage to show in the OSD.
- Launch your game and play for a few minutes.
- Look at the overlay numbers in the corner of your screen.
How to read the results:
| Situation | What It Means |
|---|---|
| GPU at 95–100%, CPU under 80% | Normal GPU bottleneck — healthy for gaming |
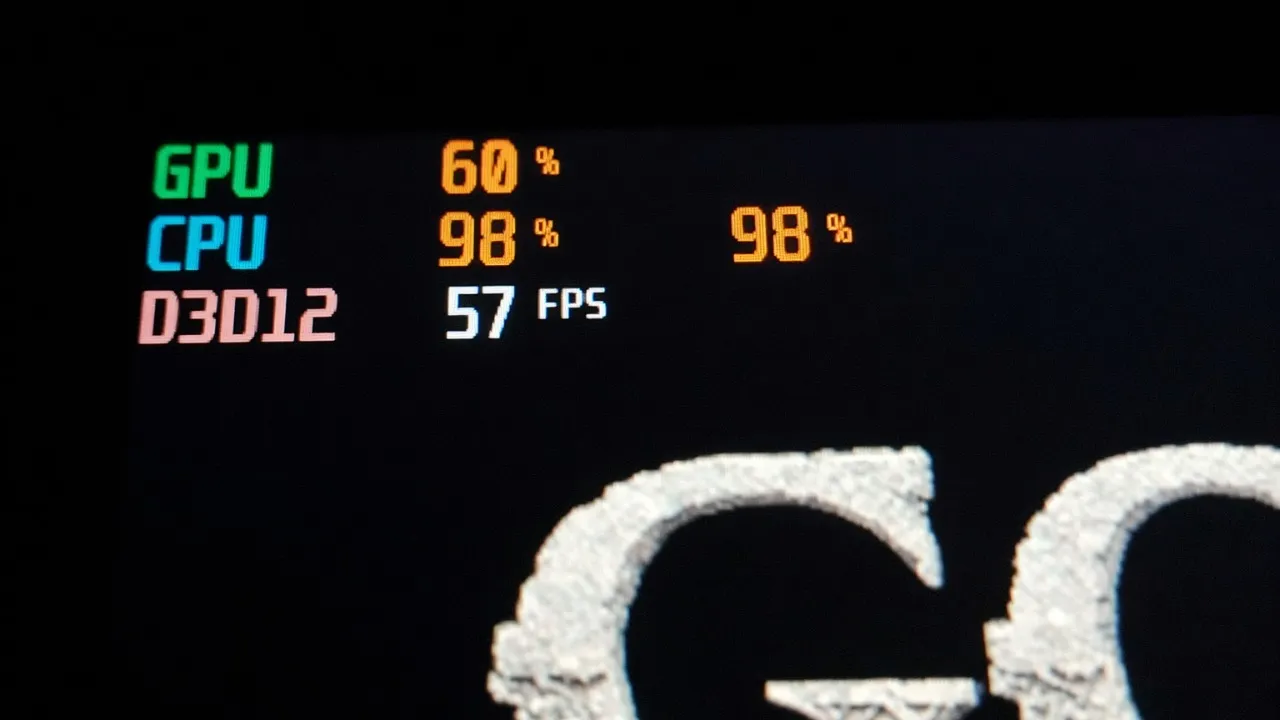
| CPU at 95–100%, GPU under 70% | CPU bottleneck — CPU can’t feed GPU fast enough |
| Both under 80%, low FPS | Could be RAM, thermals, or driver issues |
| Both near 100% | System is fully saturated — time to upgrade |
Step 2: Check Task Manager for a Quick Sanity Test
If you don’t want to install anything right now, Windows Task Manager gives you a fast rough picture.
- Press Ctrl + Shift + Esc to open Task Manager.
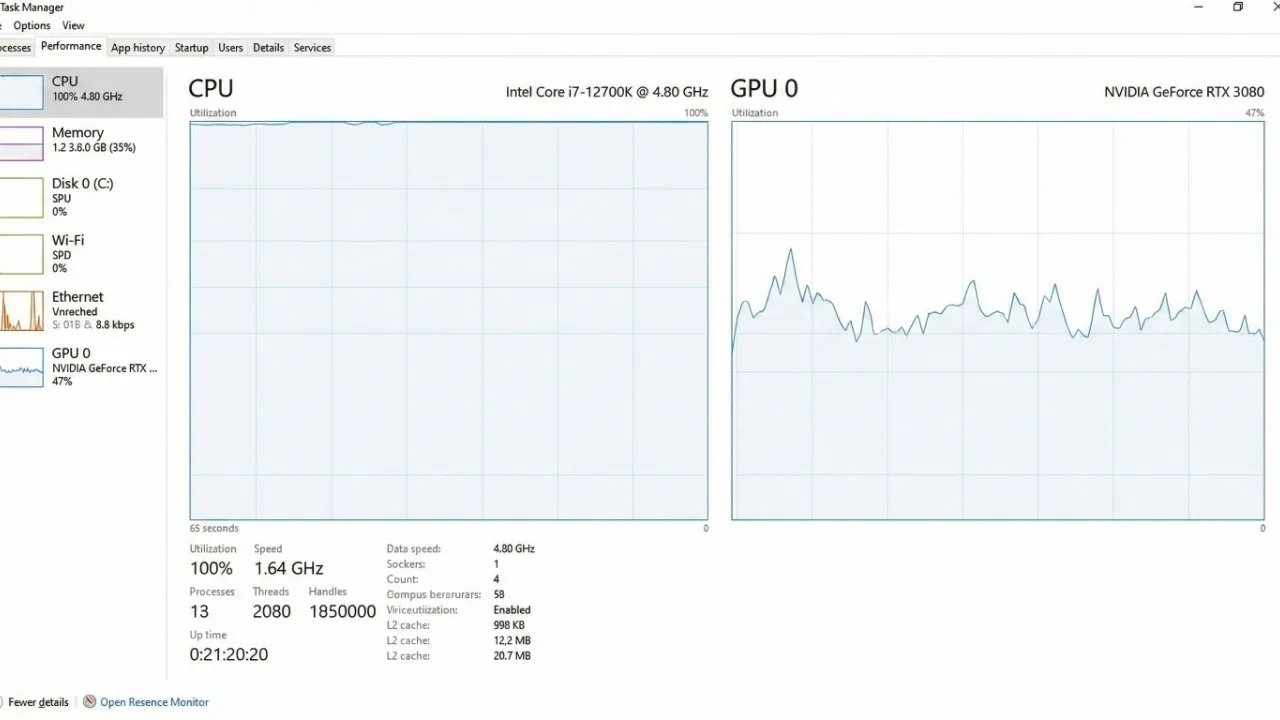
- Go to the Performance tab.
- Open your game in windowed mode.
- Watch the CPU and GPU graphs while playing.
This method isn’t as precise as Afterburner because Task Manager doesn’t update fast enough, but it can quickly confirm if one component is obviously maxed out.
Step 3: Use HWiNFO64 for Deeper Per-Core Analysis
Sometimes a CPU bottleneck isn’t obvious at the total CPU level — it’s hiding in a single core. Many older games are poorly threaded and hammer one or two cores to 100% while the rest barely break a sweat. HWiNFO64 shows you per-core usage, which Task Manager often masks by averaging everything out.
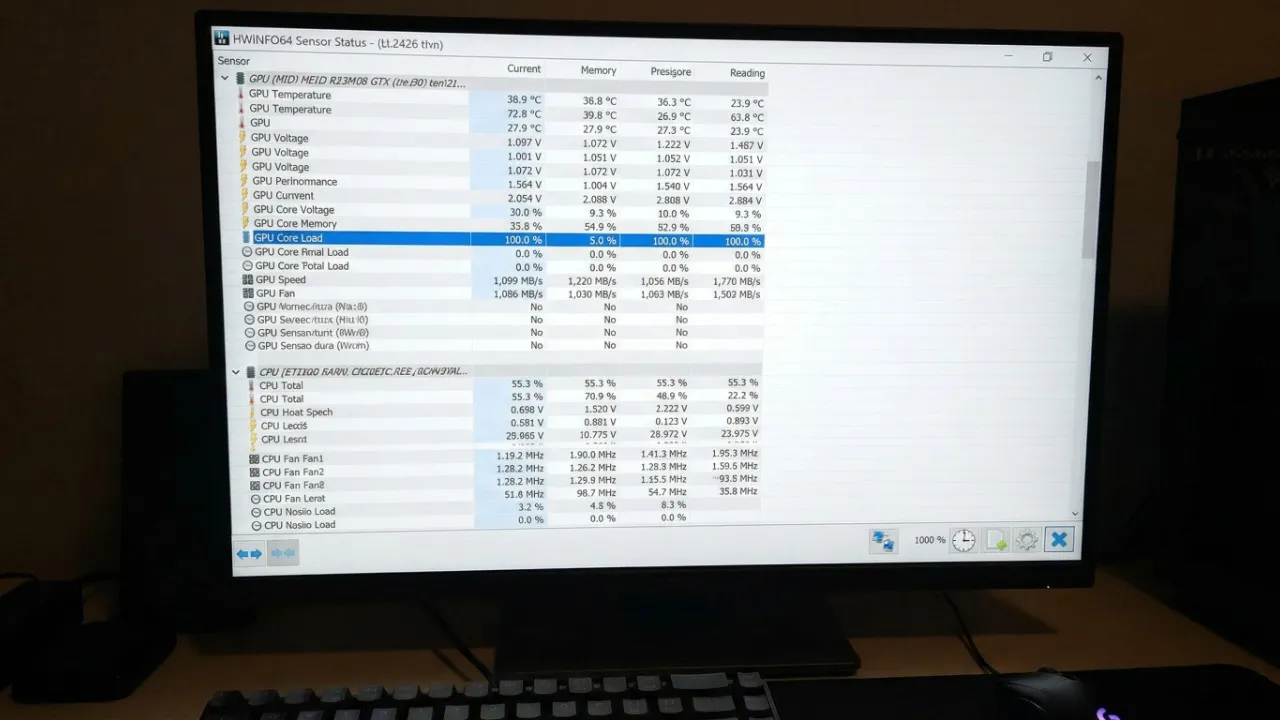
- Install and run HWiNFO64 in Sensors mode.
- Find the CPU Core Load section.
- While gaming, look for any individual core sitting at or near 100%.
If core #0 or core #1 is pinned at 100% while others are at 40–50%, that’s a single-threaded CPU bottleneck — very common in games like older GTA titles, Minecraft Java, or poorly optimized open-world games.
Signs You Have a CPU Bottleneck
You don’t always need monitoring tools to suspect a CPU bottleneck. Watch out for these real-world symptoms:
- FPS drops when there are lots of NPCs, AI characters, or explosions on screen — but the scene looks simple graphically.
- FPS is lower in multiplayer modes than in single-player with the same settings.
- Lowering your graphics settings (shadows, resolution, textures) barely improves your FPS.
- Your GPU usage hovers around 50–70% even at maximum graphics settings.
- The game stutters or hitches every few seconds, especially in open-world areas.
If any of these match what you’re experiencing, your CPU is almost certainly the limiting factor. We have a dedicated guide on how to reduce CPU usage while gaming that digs deeper into fixes.
Signs You Have a GPU Bottleneck
A GPU bottleneck is actually what you want in most cases — it means your CPU is doing its job efficiently and your GPU is the one being pushed. But if your GPU is bottlenecked and still can’t hit your target FPS, here’s how it shows up:
- GPU usage is consistently at 99–100% and FPS is still low.
- Increasing or decreasing resolution makes a noticeable difference to FPS.
- The game is visually demanding (lots of particles, shadows, large draw distances) but CPU-light.
- Enabling or disabling anti-aliasing and ambient occlusion directly impacts your frame rate.
A GPU bottleneck means your graphics card simply can’t render frames fast enough. The solution is usually lowering GPU-heavy settings — resolution, shadows, anti-aliasing, and draw distance — rather than anything CPU-related.
How to Fix a CPU Bottleneck Without Buying New Hardware
Before you go shopping for a new processor, try these fixes — many people see meaningful FPS gains without spending a cent.
Raise Your In-Game Resolution or Graphics Quality
This sounds backwards, but it actually works. When you raise the resolution or increase graphical settings, you’re shifting more workload onto the GPU. This gives the CPU some breathing room and can actually improve overall frame pacing and smoothness. Try bumping resolution up one step or enabling resolution scaling if your game supports it.
Close Background Processes Before Gaming
Your CPU is juggling your game, Windows, browser tabs, Discord, and whatever else is running. Kill anything non-essential before you launch a game. Check out our guide on stopping background apps from killing your FPS in Windows 11 for a step-by-step approach.
Set Your Power Plan to High Performance
Windows often throttles CPU performance by default. Go to Control Panel → Power Options and switch to High Performance or Ultimate Performance (if available). This prevents the CPU from downclocking during gaming. Our full best power plan settings for gaming guide covers this in more detail.
Enable XMP/EXPO in BIOS for Your RAM
Slow RAM is one of the most overlooked causes of CPU bottlenecks. If your RAM is running at its default JEDEC speed (usually 2133MHz or 2400MHz) instead of its rated speed, your CPU’s memory bandwidth is being choked. Enabling XMP or EXPO in BIOS takes about two minutes and can improve 1% lows and frame times noticeably.
- Restart your PC and enter BIOS (usually Del or F2 on boot).
- Find the XMP or EXPO profile setting.
- Enable it and save.
- Your RAM will now run at its rated speed.
Disable CPU Core Parking
Windows sometimes parks CPU cores to save power, which can introduce stutters and frame time spikes. You can disable this using the free tool ParkControl.
⬇️ Download ParkControl (Free)
How to Fix a GPU Bottleneck
If your GPU is the bottleneck and you’re still not happy with performance, these tweaks will help squeeze more out of your graphics card.
Lower GPU-Heavy Settings First
Not all settings cost the same amount of GPU performance. These are the biggest offenders to reduce first:
- Anti-aliasing (MSAA especially) — switch to TAA or DLSS if available
- Ambient occlusion — drop from Ultra to Medium or Off
- Shadow quality — very GPU heavy; reduce to Medium
- Draw distance / Level of Detail — reduce if in open-world games
- Volumetric effects — fog, clouds, and particles are frame-rate killers
Use DLSS, FSR, or XeSS Upscaling
If your GPU supports NVIDIA DLSS, AMD FSR, or Intel XeSS, enable it. These AI-powered upscaling techniques render the game at a lower resolution internally and upscale it — giving you significantly more FPS with minimal visual quality loss. It’s one of the single most effective GPU bottleneck fixes available today.
Update Your GPU Drivers
Outdated drivers can cost you real frames. Visit NVIDIA or AMD’s website directly and grab the latest Game Ready or Adrenalin drivers for your card. Our guide on Nvidia and AMD FPS settings walks through the driver panel tweaks that matter most.
Check GPU Temperatures
If your GPU is throttling due to heat, it will artificially limit performance. Use MSI Afterburner to check temperatures under load. Anything above 90°C is a concern. Clean your PC of dust and consider repasting the GPU if it’s a few years old.
CPU vs GPU Bottleneck: Quick Reference Table
| Symptom | Likely Cause | First Fix to Try |
|---|---|---|
| GPU usage below 70%, low FPS | CPU bottleneck | Close background apps, raise resolution |
| GPU at 99–100%, low FPS | GPU bottleneck | Lower shadow/AA settings, enable DLSS/FSR |
| Stutters with drops every few seconds | CPU single-core or RAM | Enable XMP, check per-core usage |
| Low FPS only in multiplayer | CPU bottleneck | Raise resolution, lower NPC density |
| FPS drops with more on-screen action | CPU bottleneck | Lower simulation quality settings |
| Changing resolution fixes FPS | GPU bottleneck | Use resolution scaling or upscaling |
What About RAM — Can It Bottleneck FPS Too?
Yes, and it’s more common than most people think. RAM acts as a pipeline between your CPU and storage. If your RAM is too slow or running in single-channel mode, it can create a bottleneck that looks like a CPU bottleneck in monitoring tools.
Make sure your RAM is:
- Running in dual-channel (two sticks in the correct slots — check your motherboard manual)
- Running at its rated XMP/EXPO speed in BIOS
- Sufficient capacity — 16GB is the modern gaming minimum, and 32GB is increasingly recommended for newer titles
According to Digital Foundry’s hardware testing, RAM speed has a measurable impact on 1% lows in CPU-bound scenarios, especially in open-world games with large streaming environments.
A Note on Online Bottleneck Calculators
You’ve probably seen websites that let you plug in your CPU and GPU model and spit out a “bottleneck percentage.” While these can give a rough idea, treat them with healthy skepticism. Bottlenecking depends on the game, resolution, settings, RAM speed, and driver version — none of which a simple calculator accounts for.
Real-time monitoring with Afterburner or HWiNFO64 while actually playing your game will always give you more accurate and actionable data than any static calculator. For a broader look at common performance myths, check out our piece on FPS myths tested — 15 boosts that don’t really work.
According to Tom’s Hardware’s benchmark methodology, GPU-bound testing at high resolutions is the only reliable way to isolate true hardware performance from system-level variables.
Summary: How to Identify and Fix Your FPS Bottleneck
Here’s a quick recap of everything covered:
- Install MSI Afterburner and enable the GPU + CPU usage overlay.
- Play your game for a few minutes and read the numbers.
- CPU near 100%, GPU under 70% = CPU bottleneck. Close background apps, enable XMP, lower game simulation settings.
- GPU near 100%, CPU has headroom = GPU bottleneck. Lower shadows, AA, enable DLSS/FSR, update drivers.
- Use HWiNFO64 to check for single-core bottlenecks that total CPU usage hides.
- Check RAM speed in BIOS — slow RAM mimics a CPU bottleneck.
Once you know which component is your actual limiter, you stop wasting time fixing the wrong thing and start getting real results.
Next Step
Now that you know what’s bottlenecking your system, the next move is to act on it. If you’re dealing with persistent FPS drops and stutters even after identifying the bottleneck, our full guide on how to fix FPS drops in games covers every scenario in depth.
Got questions about your specific setup? Drop them in the comments below — we read every one.